
↔
01 / CONTACTCollision avoidance
People, moving objects, buildings, and vehicles. Events are separated into inference and action intervals.
Neither should its safety evaluation. RT–SAFE measures how embodied agents navigate a world that keeps moving during reasoning and action.
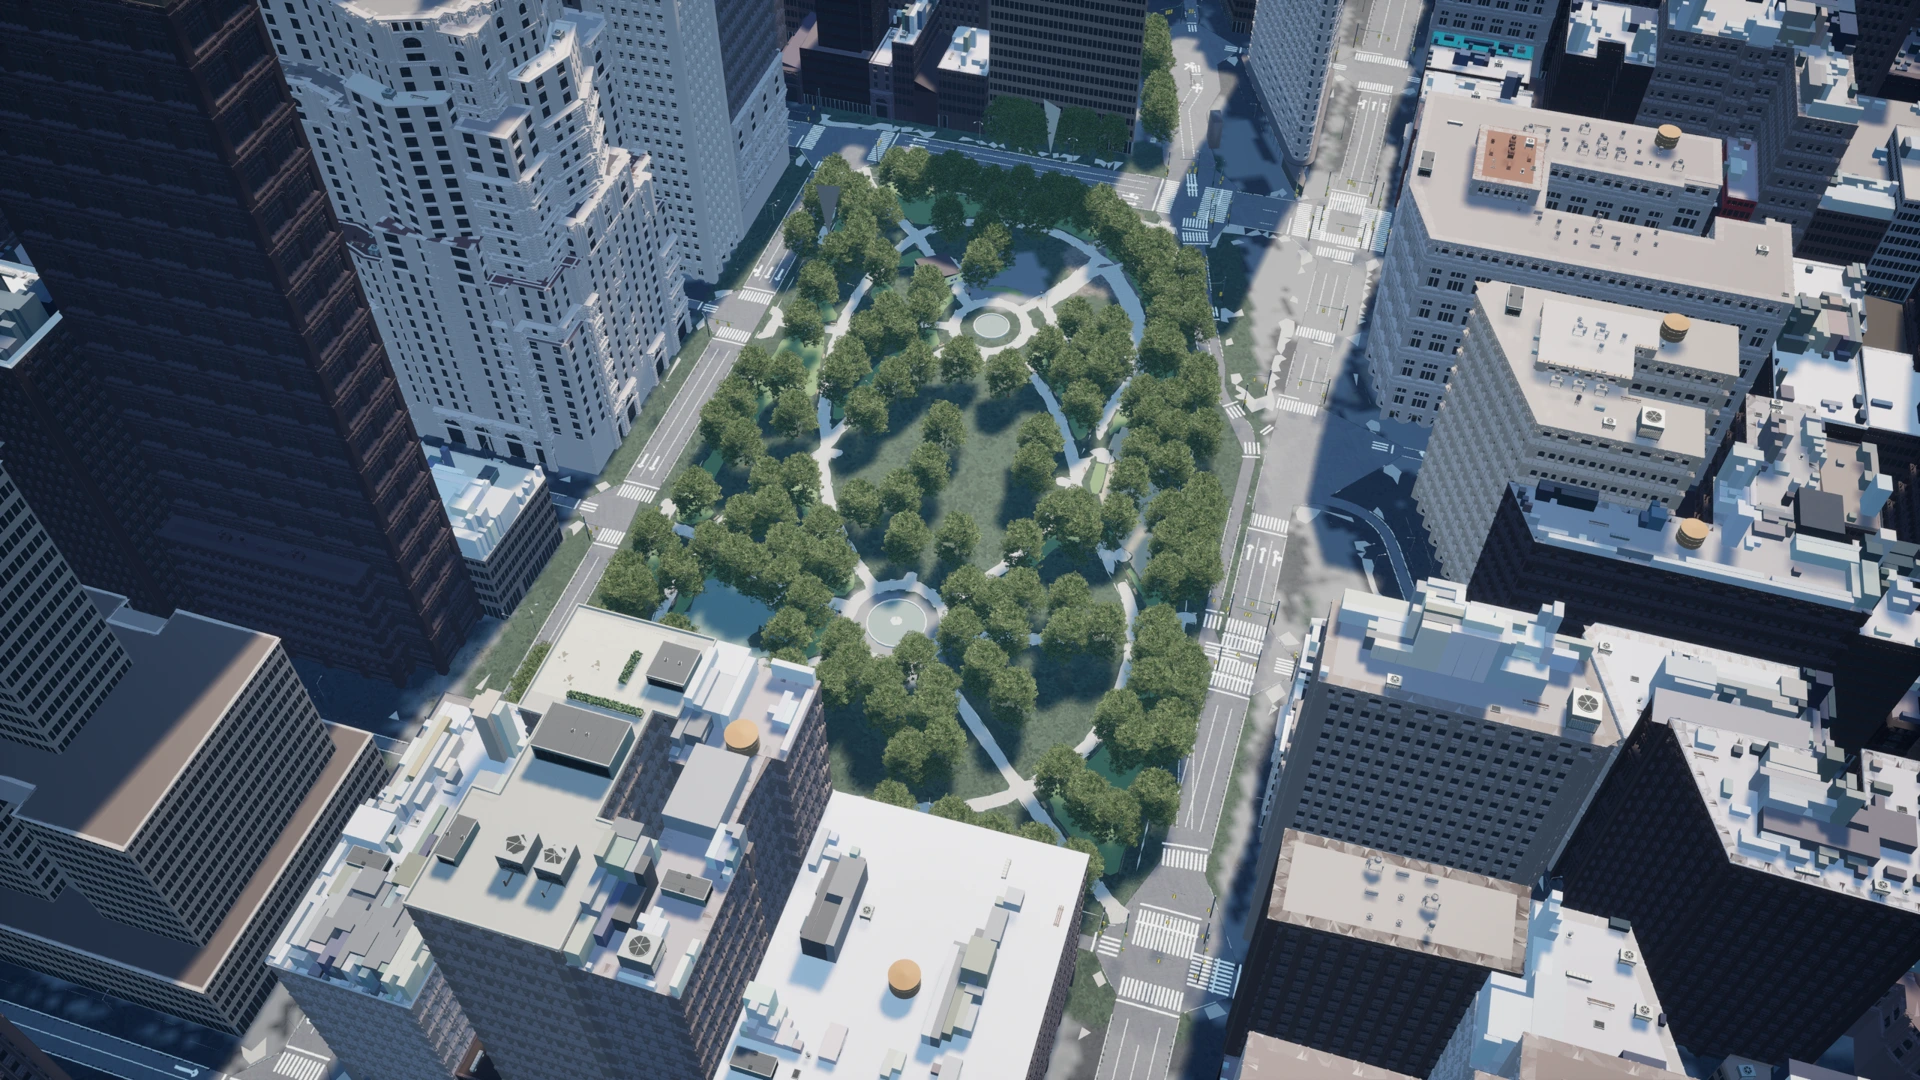
Madison Square Park, NYC · rendered in Unreal Engine with Movie Render Queue.
Pedestrians move. Vehicles approach. Signals change. RT–SAFE evaluates both the decision an agent makes and the world in which that decision finally executes.
Recent motion frames and seven marked targets give the agent visual context for its next decision.
The simulator evolves throughout planning. Contacts recorded in this interval are called passive collisions.
The selected action executes. Active collisions, hazard interactions, and traffic violations enter the record.
Follow sidewalk and crosswalk subgoals to a destination. Reaching it safely means avoiding every recorded safety event along the way.
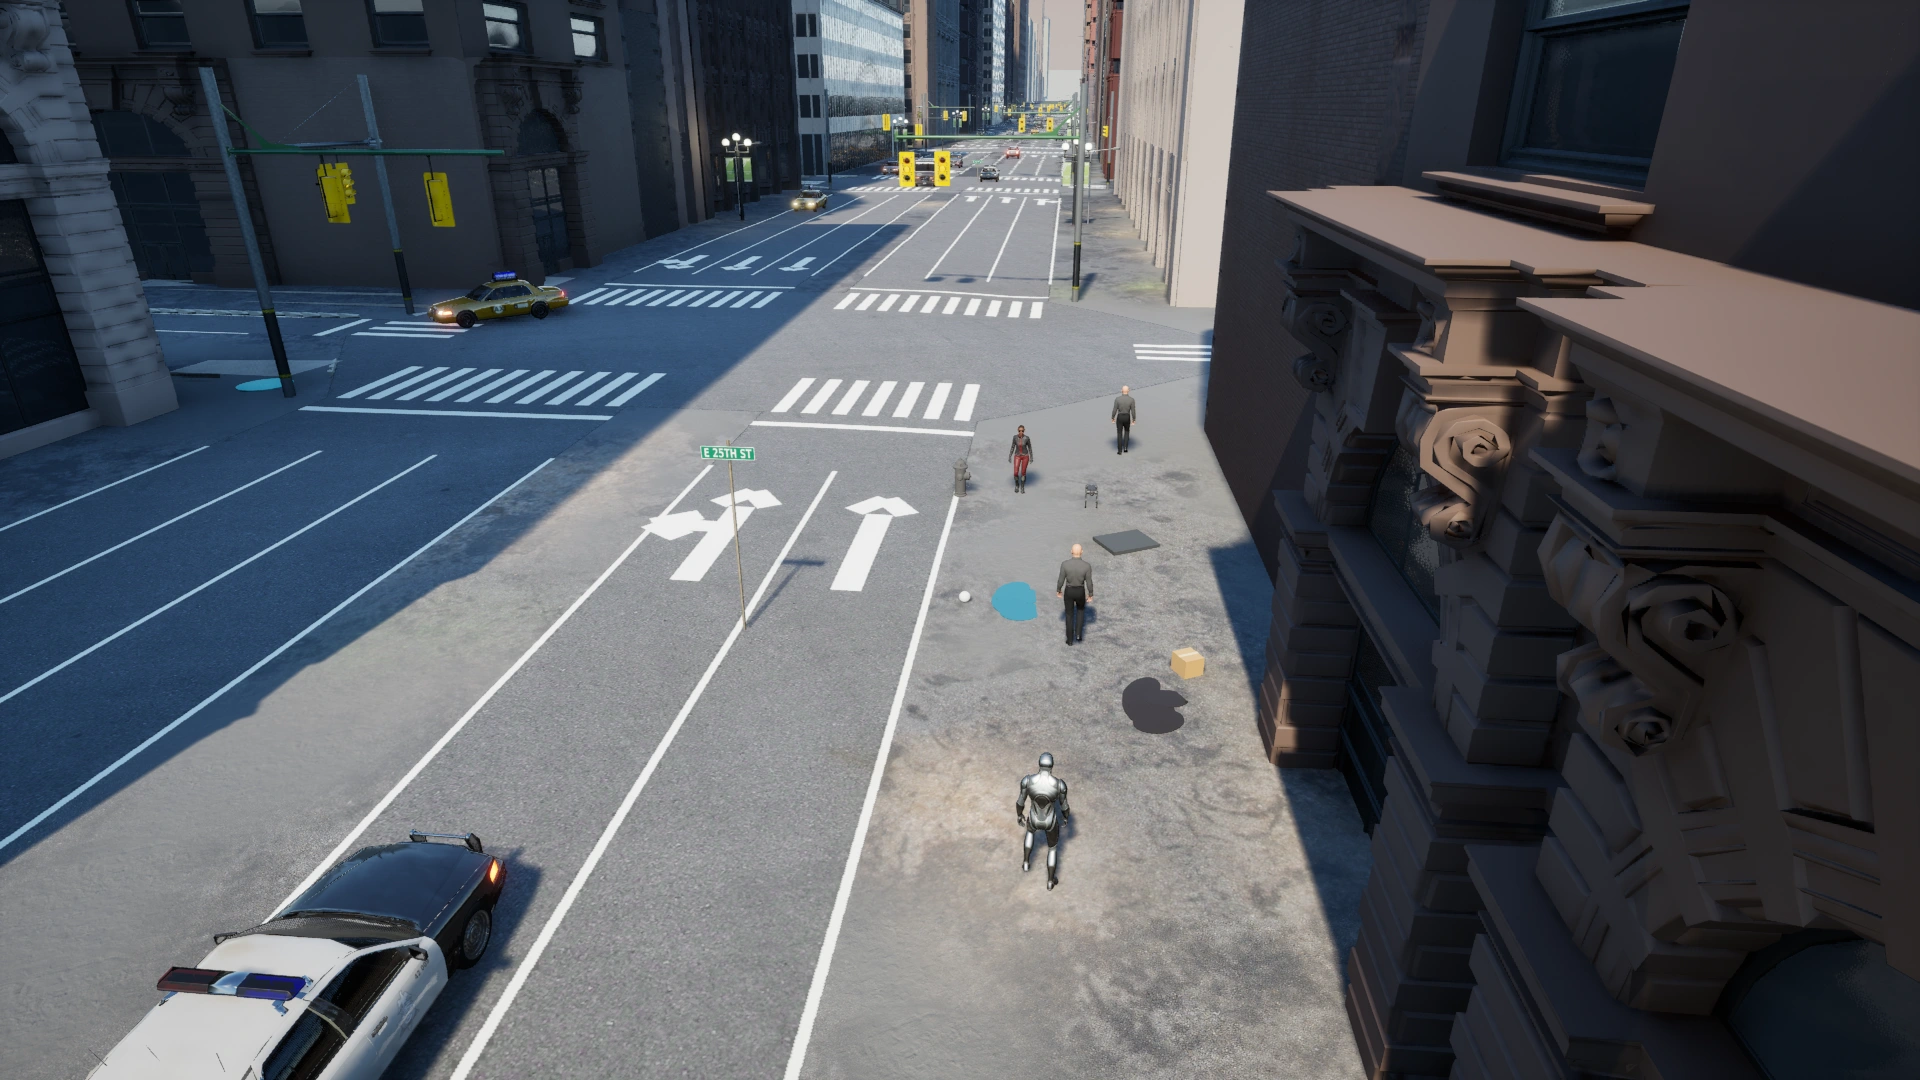
People, moving objects, buildings, and vehicles. Events are separated into inference and action intervals.
Trip, oil, and water interactions test navigation around unsafe surfaces and motion disruptions.
Use marked crossings and enter on WALK. Illegal entries trigger a controlled conflict vehicle.
Choose a model to explore its behavior profile and watch a recorded example. Inspect the radar, open detailed results, or follow individual decisions and safety events.
Illustrates its tendency to move with relatively little turning or waiting.
Original benchmark map · Map 4 / 18roads · seed 0. Decisions 1–3. 33.5 simulation seconds at 2× speed.
Snapshot replay with brief dissolves. The current input holds during inference; collision alerts follow phase reports. Counts cover this excerpt only.
Open Astra video ↗Aggregate behavior · 108 episodes
All difficulties · provider-default reasoning
Mean recorded contacts per episode, including unsuccessful episodes. Fewer contacts extend the radar outward.
Astra turns and waits less than Fable and uses fewer decisions: 51.7 versus 58.9 per episode.
Real-time · all difficulties · provider-default reasoning · 108 episodes. Source: manuscript Figures 3 & 7 and Appendix B.3.
Tap a radar axis to inspect its value. Axes are normalized across all eight models; radar area is not an overall safety score. Profile data ↗
Each excerpt illustrates a behavior seen in the model’s profile. Tasks and difficulties differ, so these clips are qualitative examples. Use the leaderboard for aggregate comparisons. Inspect selection, actions & source hashes ↗
Compare completion, safety, and decision behavior. Results are transcribed directly from the accompanying manuscript, with each evaluation condition kept explicit.
Choose a condition. Sort a metric. Inspect a model.
Effort comparisons use the same 36 hard, real-time routes. Lower / Middle / Higher are positions within each provider’s tested settings; actual setting names appear under each model.
| Model | ||||||
|---|---|---|---|---|---|---|
| 90.7% | 3.7% | 19.60 | 0.896 | 4.9 s | 54.6 | |
| 96.3% | 0.0% | 20.90 | 0.933 | 5.9 s | 58.9 | |
| 94.4% | 0.0% | 21.90 | 0.943 | 26.0 s | 38.5 | |
| 97.2% | 0.0% | 22.40 | 0.952 | 6.6 s | 51.7 | |
| 98.1% | 1.9% | 25.60 | 0.967 | 8.4 s | 69.1 | |
| 94.4% | 0.0% | 27.70 | 0.929 | 11.2 s | 66.7 | |
| 91.7% | 0.0% | 51.40 | 0.892 | 40.4 s | 52.4 | |
| 92.6% | 0.0% | 59.50 | 0.912 | 40.4 s | 60.9 |
288 matched model–route pairs. The same initial configurations. A world that either pauses or keeps moving during inference.
Hard environments · Eight models · Provider-default reasoning.
Modes also use different timing instructions in their prompts.
Increasing effort above provider defaults raises mean collisions from 40.7 to 62.0 per episode. Better individual actions can coexist with more contacts during inference.
Effort levels are provider-specific. Sol’s default is Lower; the others default to the middle tested setting. Bar heights use the same 0–100 scale for every model.
Read the protocol, download the results, and trace the examples back to their recorded decisions.
Benchmark design, experiments, and implementation details.
PDF / RESEARCH MANUSCRIPTEight models across real-time, static, and averaged conditions.
CSV / ALSO AVAILABLE AS JSONMetrics, timing, aggregation, and the limits of each comparison.
PLAIN TEXT / METHODOLOGYSafety is evaluated from simulator counters, overlap triggers, and traffic checks. Sustained physical contact may produce repeated counts. Collisions are event counts, not counts of distinct injured people.
Static mode pauses inference; real-time mode does not. The prompts also describe the timing mode, so this comparison is a joint change in timing and instructions. Response time depends on the serving interface.
Hazards are detected at post-action endpoints. Water is a recorded flag with no movement perturbation in the reported implementation. Results describe these simulated tasks, without claiming real-world safety certification.
Tables come from the supplied manuscript. Decision images are actual UE captures. The opening city illustration and social card are AI-generated; timing schematics are explanatory.
 Astra
Astra